
By Claudia Sanchez
The Independent Inquiry into White Working Class Educational Outcomes was published on 29 June, commissioned by the Star Academies Trust and backed by the Department for Education.1 Its headline finding: only 36% of white British pupils on free school meals get a grade 4 or above in English and maths GCSE, against 72% of pupils who are not on free school meals.2 Bridget Phillipson welcomed the report, telling teachers that white working-class children now had a government that will fight for them.3 Two weeks earlier, Nigel Farage had published a 7,000-word essay demanding repeal of the 2010 Equality Act on the grounds that white children are the victims of a “two-tier state.”4
The attainment gap the inquiry describes is real. A Reform leader and a Labour government have each built a racial claim on top of it that does not survive contact with the data. “White working class” is not the same thing as “white British and eligible for free school meals.”
The critical race theorist David Gillborn made this point about the 2021 parliamentary committee report this inquiry now echoes in substance: roughly six in ten people in Britain identify as working class, yet free-school-meal-eligible pupils account for something closer to one white state-school pupil in seven.5 Swap “FSM” for “working class” in a headline and the group being discussed suddenly looks about four times larger than it actually is, and a much larger group of white British people start to feel their own children are being held back by a fight that, on the actual data, concerns a smaller and much more specifically poor population. The inquiry’s own report calls FSM eligibility “the best available proxy” for a category it admits has no agreed definition.6
The sociologist Sam Taylor Hill, reviewing this debate, draws on Beverley Skeggs’ argument that public contempt for poverty lands most comfortably on white subjects specifically, because mocking a white target avoids the accusation of racism the same treatment would invite against a minority group.7 Programmes like Benefits Street and the Jeremy Kyle Show, and the wider “chav” stereotype, are overwhelmingly populated by white participants for this reason: whiteness functions as a kind of shield that makes contempt for poverty sayable in a way it otherwise would not be. That same shield is available to Farage and to the inquiry, just turned to face the opposite direction. Framing disadvantage as a specifically white problem lets it be discussed as a grievance, rather than risk being read as the kind of poverty-shaming that would draw immediate criticism if aimed at a minority group instead.
The inquiry’s report goes further than the 36/72 figure, claiming white British FSM pupils have worse outcomes than any other major ethnic group in England.8
In its own endnotes, the inquiry states it does not separately analyse other white ethnic groups, and that Gypsy, Roma and Traveller children face serious educational barriers of their own, which it places outside its scope.9 On the Department for Education’s own Attainment 8 data, Gypsy and Roma pupils on free school meals score 16.1 out of 90, against 30.9 for white British FSM pupils, the population this inquiry is organised around.10 Gillborn made a version of the same point about the 2021 data, on a different measure: white FSM pupils were roughly four times more likely to achieve good passes in English and maths GCSEs than children from Gypsy and Roma backgrounds.11 Different metrics, five years apart, but the same underlying decision each time: define the worst-off group out of the comparison, then declare a winner.
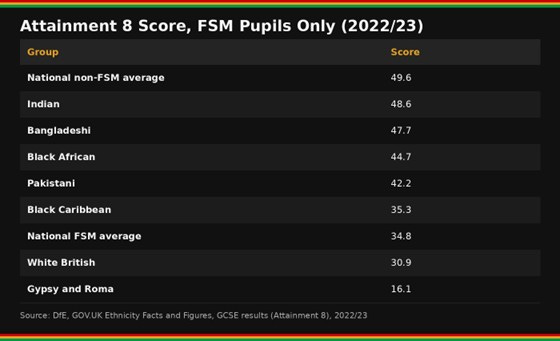
Farage’s claim is the larger one: that white British pupils are the single worst-performing group in the country as a whole. The whole-cohort data contradicts this directly.
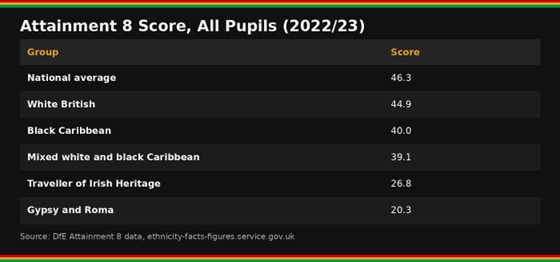
White British pupils scored 44.9 in 2022/23, below the national average of 46.3 but above black Caribbean pupils at 40.0. The lowest-scoring groups in England are white: Gypsy and Roma pupils, and Traveller of Irish Heritage pupils.12 Restrict the same data to free school meal pupils only and white British pupils fall below black Caribbean pupils, 30.9 against 35.3, an apparent reversal that is arithmetic rather than evidence: the whole-cohort figure for white British pupils is inflated by a large non-FSM majority irrelevant to the comparison Farage is making. Remove that majority and the reversal disappears. That alone ends the claim that white children are, as a population, Britain’s worst-served group. Gillborn made a related point about the 2021 data: the gap between white FSM pupils and black Caribbean or dual-heritage (white and Black Caribbean) FSM pupils was negligible.13 On the current 2022/23 figures the gap has widened slightly, with black Caribbean FSM pupils a few points ahead rather than level. But the underlying picture hasn’t changed: this is nowhere close to the “worst group in the country” story Farage tells.
It does not, however, explain the residual FSM-level gap against several other ethnic groups, which is real: white British FSM pupils score below FSM pupils from Bangladeshi, Indian, Pakistani and black African backgrounds by margins larger than the 14.8-point national gap between FSM and non-FSM pupils generally.14 Free school meal status is the one variable held constant here. Something else requires explanation.
The explanation is not racial privilege operating against white children, and it is not a cultural deficiency among poor white families. It is what several decades of deindustrialisation do to a community’s relationship with the institution of schooling. Diane Reay’s research for the Runnymede Trust found that white working-class communities carry generations of inherited experience of schooling as a mechanism of social sorting rather than social mobility, while many migrant-heritage families arrive carrying either an intact achievement ethos from their country of origin or a belief that British schooling offers a fresh start unavailable to their own parents.15 The Sutton Trust’s 2026 research adds a concrete mechanism: pupils from black African, Bangladeshi, black Caribbean, Pakistani and Indian FSM backgrounds are four to five times more likely to receive private tutoring than white British FSM pupils, a gap in family investment that tracks the aspiration gap Reay describes rather than causing it independently.16
None of this is new. In 2021 the House of Commons Education Committee, with seven Conservative and four Labour members, published a report reaching a similar conclusion about the scale of the gap.17 But the committee was not unanimous, and the report itself became a flashpoint rather than a settled consensus: alongside its economic analysis, it recommended that schools consider whether teaching concepts like “white privilege” was consistent with their duties under the Equality Act, a recommendation Labour members did not sign off on.18 Gillborn’s response at the time noted the specific danger in the committee’s own logic: a report proposing to help disadvantaged white children only, in isolation from every other disadvantaged group, is the kind of decision the committee’s own Labour minority described as one that would “systematically disadvantage other ethnic groups and increase racial educational inequalities.”19 Gillborn went further, pointing out the report’s own contradiction: it treats open discussion of racism as divisive, while presenting its own proposal to direct resources toward white children specifically, and no other disadvantaged group, as a neutral way of avoiding division between groups, a framing he judged to be privileging white people in exactly the way it claimed to be avoiding.20 The 2026 inquiry has revived a version of the same argument.
The comparison with London, where minority pupils outperform white pupils, is Farage’s other pillar. White British pupils are heavily concentrated outside the capital: only around 1 in 20 of them live in London, compared with roughly half of Bangladeshi and black Caribbean pupils.21 The Sutton Trust’s analysis finds regional attainment gaps are not driven mainly by anything London’s schools do differently. They are driven by which pupils, of which ethnicities, happen to live there.
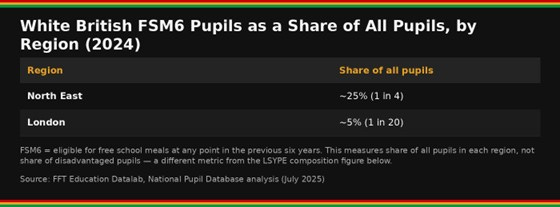
FFT Education Datalab’s analysis of the full National Pupil Database put numbers on the same pattern: white British pupils on free school meals in the last six years (FSM6) account for roughly a quarter of the North East’s pupil population, but only about one in twenty of London’s.22 An earlier DfE survey of the 2015 cohort found the same underlying fact by a different method: white pupils made up only 35.4% of London’s disadvantaged pupil population, against 82.6% in the rest of England, and this composition difference alone accounted for a third of London’s whole attainment advantage for disadvantaged pupils.23
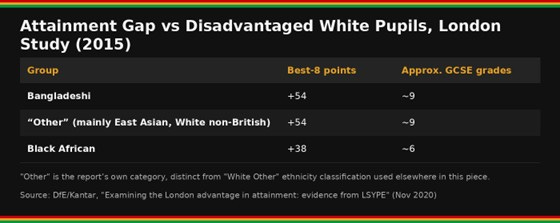
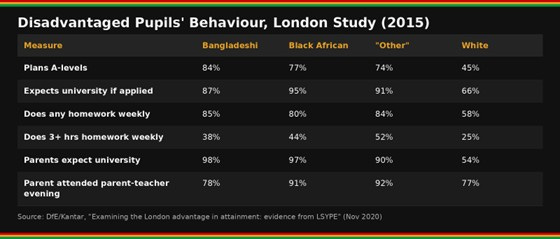
Adding behavioural factors, parental university expectations, homework frequency, aspiration, explained most of the remainder, and eliminated the contribution of ethnicity from the statistical model entirely: ethnicity had been standing in as a proxy for these factors, not a cause independent of them.24
The Sutton Trust’s most recent finding is the plainest statement of this. Despite London’s large aggregate advantage for disadvantaged pupils overall, white British FSM pupils do not share in it, and if anything come out marginally ahead in the North East instead.25 FFT’s separate analysis found the share of white British FSM6 pupils reaching the GCSE “basics” benchmark is effectively the same in London as in the North East.26 Both findings rule out favourable treatment of minority pupils in London’s schools, since white FSM pupils gain nothing from being there, and both rule out a purely resource-based geography argument for attainment specifically. If under-funded schools and thin local opportunity explained the gap on their own, relocating this population into London’s funding envelope should show up as an improvement, and it does not.
Farage’s essay collapses poor white families into white people as a whole, implying the group is Britain’s most economically disadvantaged population. Government poverty statistics for the three years to 2024/25 show child poverty at 63% among Bangladeshi children and 52% among Pakistani children, against 22% among white children and a national rate of 31%, consistent with over a decade of DWP and ONS findings that Pakistani and Bangladeshi households face child poverty at two to three times the white British rate.27
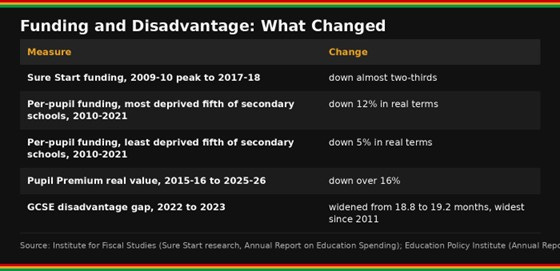
The material forces that actually produced the attainment gap are documented and unambiguous. Sure Start funding fell by almost two-thirds between its 2009-10 peak and 2017-18.28 Between 2017/18 and 2022/23 the least deprived schools saw bigger real-terms funding increases than the most deprived did, the opposite of what a policy aimed at levelling up poorer areas would produce, in the IFS’s own assessment.29 Pupil Premium has lost over 16% of its real value since 2015/16.30 The GCSE disadvantage gap narrowed from 19.7 months in 2011 to 18.2 months in 2014, then widened back out to 19.2 months by 2023, its worst point in over a decade.31 None of these were decisions made by an ethnic minority population or by equality legislation. They were budget decisions, made by governments, that fell disproportionately on the schools serving the poorest children of every background.
In January 2007 the Daily Mail ran a structurally identical comparison: 24% of disadvantaged white boys achieved five good GCSEs against 33.7% of black African boys from similarly poor households, framed as a warning that the gap could benefit the British National Party.32 The Runnymede Trust’s David Gillborn showed that the poverty gap between white FSM pupils and their own better-off white peers was, in that data, more than three times the size of the FSM-level gap between white and black African pupils, and that it was nonetheless the smaller, racialised number that made the headline.33 Gillborn made versions of this same argument about the 2007 coverage and again about the 2021 committee report. The same pattern is what this inquiry repeats now. The specific figures move. The underlying operation does not: a class gap is measured, and a racial explanation is supplied for it.
Whose interests this serves
Reform’s material interest in the racial explanation is the most direct of the two. The party’s 2024 manifesto proposed raising the higher-rate tax threshold to £70,000 and abolishing inheritance tax on estates under £2 million, changes that would principally benefit high earners; fewer than 5% of estates currently attract inheritance tax at all.34 It has since proposed a “Britannia Card,” a ten-year exemption from UK tax on overseas income for non-domiciled residents, available for a one-off £250,000 payment.35 Three donors, Christopher Harborne, Jeremy Hosking and Richard Tice, have supplied three-quarters of the more than £30 million Reform has raised since 2019.36 A platform structured around tax reductions for capital requires, for the working-class voters it will cost most, a supplied enemy that is not the platform itself.
Labour’s interest is less direct but points the same way. Adopting the language of white working-class grievance, without adopting Farage’s specific causal claim, allows a government under sustained electoral pressure from Reform to be seen to address the concern while continuing to operate inside the same fiscal settlement that produced the gap. An inquiry organised around a racial category, using a term as loosely defined and as inflated in its apparent scale as “white working class,” can be welcomed in a press statement without committing any government to reversing the Sure Start cuts, the regressive school funding formula, or the Pupil Premium’s declining real value that this piece has documented. What Labour offers in exchange is smaller and more respectable than what Farage offers, but it buys the same thing: a working class persuaded to understand its own immiseration through racial rather than class categories will not ask who cut the funding, and will not notice that the “working class” being discussed was, all along, a much smaller and more specific group than the term implied.
Notes
1. Independent Inquiry into White Working Class Educational Outcomes, 2026.
2. Ibid; figures reported consistently by Star Academies and mainstream coverage of the launch.
3. Reported widely following the inquiry’s publication, 29 June 2026.
4. Farage, “Britain is a two-tier state – against white people,” Substack, 15 June 2026.
5. Gillborn, D., “How white working-class underachievement has been used to demonise antiracism,” The Guardian, 23 June 2021.
6. Independent Inquiry (n 1).
7. Taylor Hill, S., “Unraveling the white working-class conundrum: A closer look at its utility and pitfalls,” Ethnicities, 24(6), 2024, drawing on Skeggs, B. (2009, 2013).
8. Independent Inquiry (n 1).
9. Ibid; endnotes.
10. DfE, GCSE results (Attainment 8), GOV.UK Ethnicity Facts and Figures, 2022/23.
11. Gillborn (n 5).
12. DfE, Attainment 8 data (n 10).
13. Gillborn (n 5).
14. DfE, Attainment 8 data (n 10).
15. Reay, D., Runnymede Trust, 2009.
16. Sutton Trust, “Crossing Paths: how gender, ethnicity and place shape opportunity,” 18 June 2026.
17. House of Commons Education Committee, The forgotten: how White working-class pupils have been let down, 2021.
18. Ibid; committee composition and lack of unanimity widely reported at the time of publication.
19. Gillborn (n 5).
20. Ibid.
21. Sutton Trust (n 16).
22. FFT Education Datalab, “The educational outcomes of disadvantaged White pupils,” July 2025.
23. DfE/Kantar, Examining the London advantage in attainment: evidence from LSYPE, November 2020.
24. Ibid.
25. Sutton Trust (n 16).
26. FFT Education Datalab (n 22).
27. Government poverty statistics, three years to 2024/25; consistent with DWP/ONS findings over the preceding decade.
28. Institute for Fiscal Studies, research on Sure Start funding, 2026.
29. Institute for Fiscal Studies, Annual Report on Education Spending in England, various years.
30. Institute for Fiscal Studies, Schools, 2026.
31. Education Policy Institute, Annual Report 2024: Disadvantage.
32. Daily Mail, 13 January 2007; analysed by Gillborn, D., Runnymede Trust, 2009.
33. Ibid.
34. Reform UK 2024 manifesto; IFS analysis.
35. Ibid.
36. Democracy for Sale research on Reform UK donors.
The above article was originally published here on the For Liberation, Against Racism blog.
To follow the For Liberation, Against Racism blog – subscribe here .